ASUS ROG Strix Scar 15: Performance
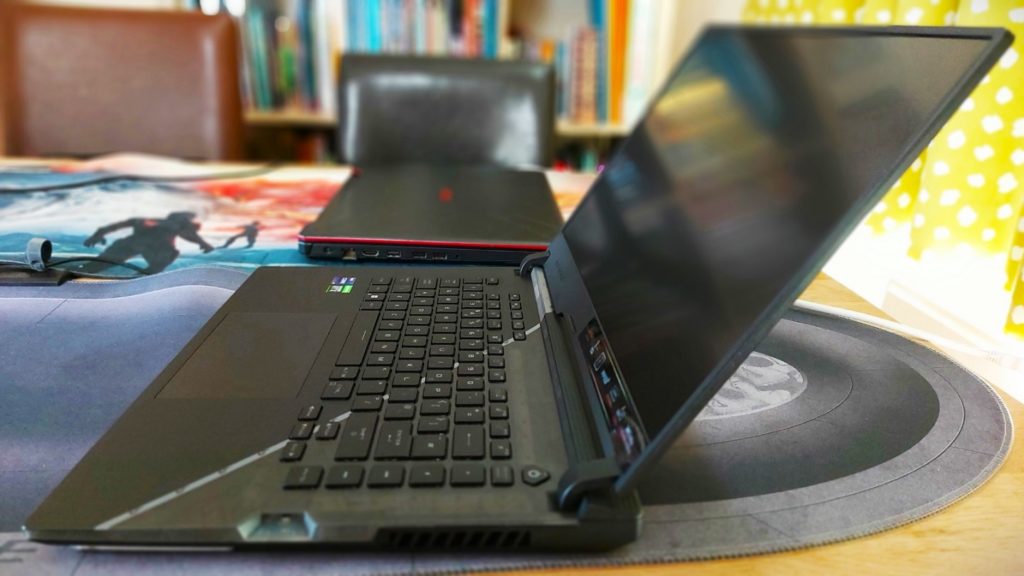
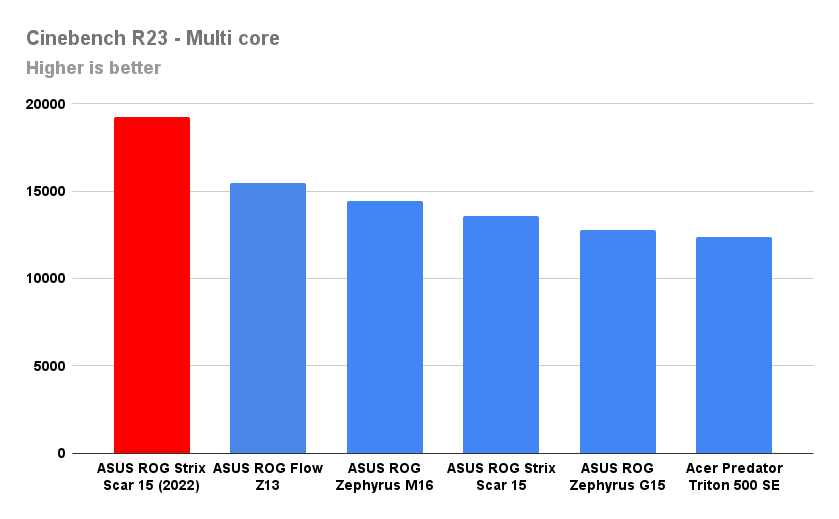
The Intel Core i9-12900H in the Scar 15 is phenomenally good, as ASUS has given it enough power to truly flex its muscles. In the Scar, it can run at a sustained power limit of 80W, but it can also operate at up to 115W for short periods. Compare this to the ROG Flow Z13 which runs the same CPU at 40W and, even though single-core performance is very similar, we see massive gains in multi-threaded performance. In terms of gaming, the difference isn’t so pronounced, as few games will need to use all of that power, but for creative work, this extra CPU headroom will make a big difference.
This gives the Scar 15 single-core performance on par with the desktop 12900F, and it’s not that far behind on multi-threaded operations, either. Compared to other mobile CPUs currently available, it’s no contest, with the i9-12900 comfortably outclassing both the previous-gen Intel CPUs as well as the best AMD has to offer.
Like all of ASUS’s 2022 ROG laptops, the Scar 15 now has a MUX (multiplexer) switch, which allows it to bypass the iGPU and extract the full performance of the GPU. It works on the in-built display, and the HDMI 2.1 and DP over USB-C inputs also connect directly to the dGPU. It’s very simple to activate; simply toggle the switch within the Armoury Crate software and you’ll be prompted to restart, after which all GPU work will be handled by the Nvidia GPU without having to pass through the iGPU. In practical terms, this helps squeeze out up to 5% more FPS, though if you’re not on mains power it will drain your battery fast.
The new RTX 3070 Ti is a superb GPU. It’s remarkable how close it benches compared to the RTX 3080, and it’s a significant step up from the 3070. At the native resolution of 1440p, you’ll get frame rates up to and even over 100fps, and for competitive titles, you can even max out the impressive 240Hz refresh rate display. I even got decent 4k results without having to lower the graphics settings.
This is a great laptop for docking to a desktop gaming setup. I have a 4k display with KVM and a set of peripherals connected, so all I have to do is plug in a USB-C and the power cable and I have a proper gaming setup ready to roll, as well as the convenience of portable power when I need it. You can use USB-C power delivery but the 100W it provides is not sufficient for gaming – the GPU runs up to 150W and the CPU can hit 115W – so you’ll need the 280W power adapter for any intensive tasks.
We did our benchmark tests using the Turbo performance setting, but even though the fans kick into overdrive, we still saw CPU temperatures frequently creeping into the 90s. You can lower temperatures by a few degrees if you prop up the rear of the Scar 15 to improve the airflow from the underside, but it’s possible to reduce temps further still.
After some digging, we discovered that the Turbo mode appears to constantly run the CPU at maximum power. If you switch to manual mode, you can adjust the maximum CPU power limits without affecting frame rates too much. Setting the PL1 (previously labelled SPL on ASUS systems – sustained power limit) to 50W and PL2 (previously SPPT) to between 50-65W gives the CPU ample power for gaming, but lowers CPU temperatures by as much as 10℃.
With these settings, frame rates were within 2-3% of those using Turbo mode but the fans ran quieter and temperatures were far better managed. You can create custom fan speed ramps, but if you aren’t comfortable tweaking these yourself I used ASUS’s preset-3 fan setting which provided a good balance between cooling and performance. You can also tweak the GPU to try to squeeze out some extra performance, but I found the default settings to be more than adequate.
Benchmarks
All benchmark tests were carried out with the performance mode set to Turbo in the Armoury Crate software, which overclocks the GPU and runs the CPU at its maximum, dynamically adjusting fan speed to keep everything cool.
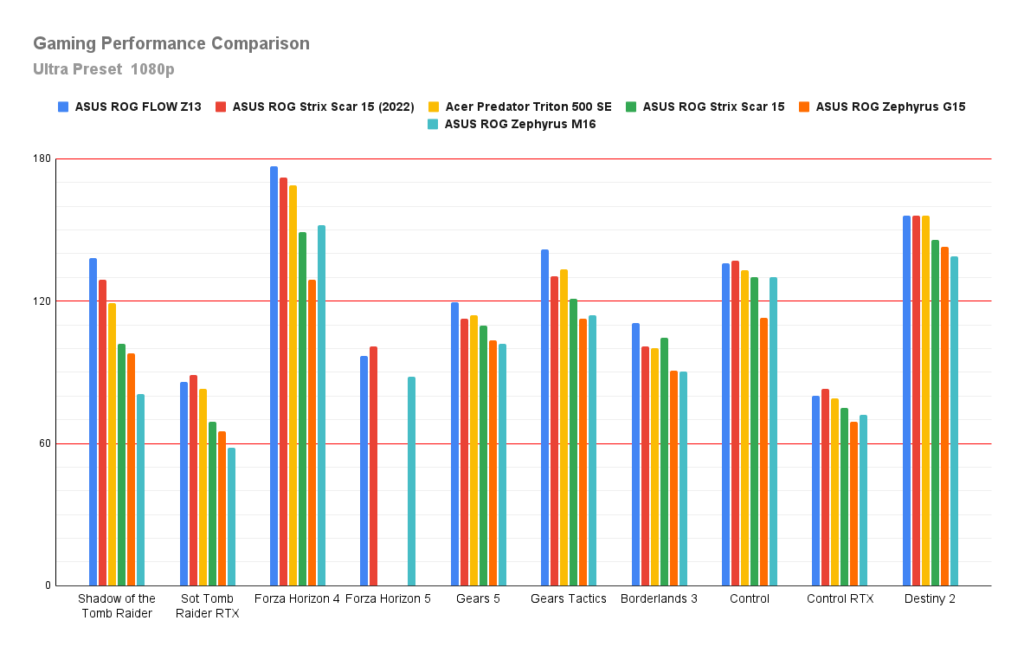
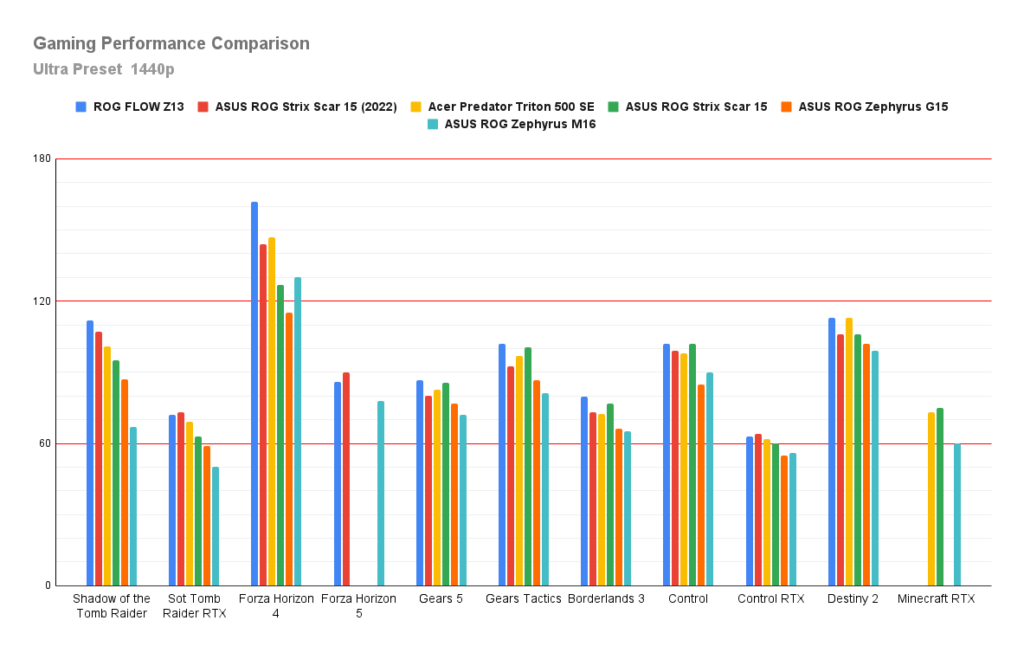
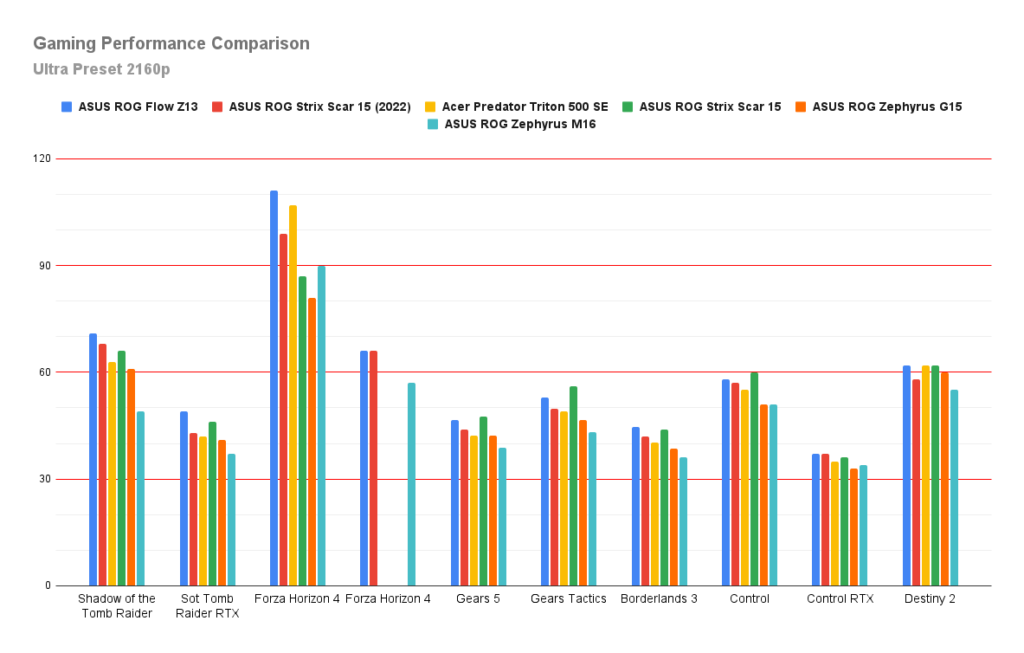
Benchmarks were recorded at 1080p, 1440p and 2160p using an external display connected via DisplayPort over USB-C. If DLSS was available, it was set to performance mode unless stated otherwise. 1440p results were cross-checked between the internal and external displays, with both recording identical results.
Gaming Benchmark Results
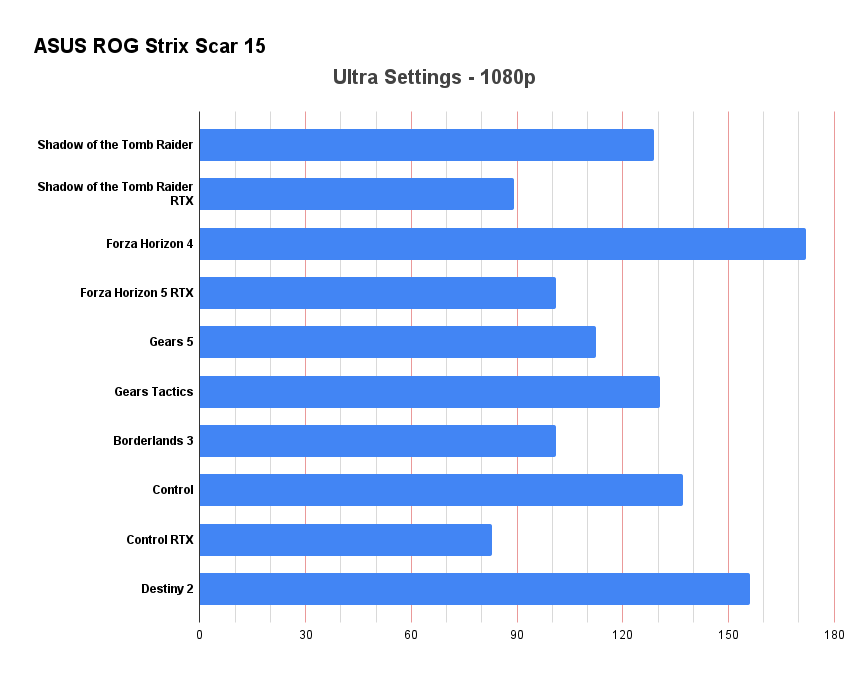
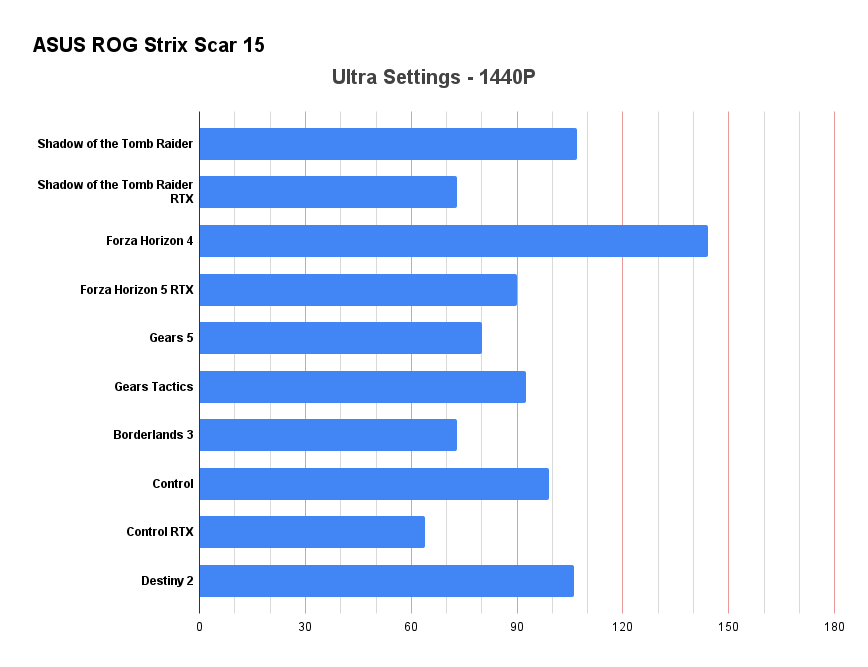
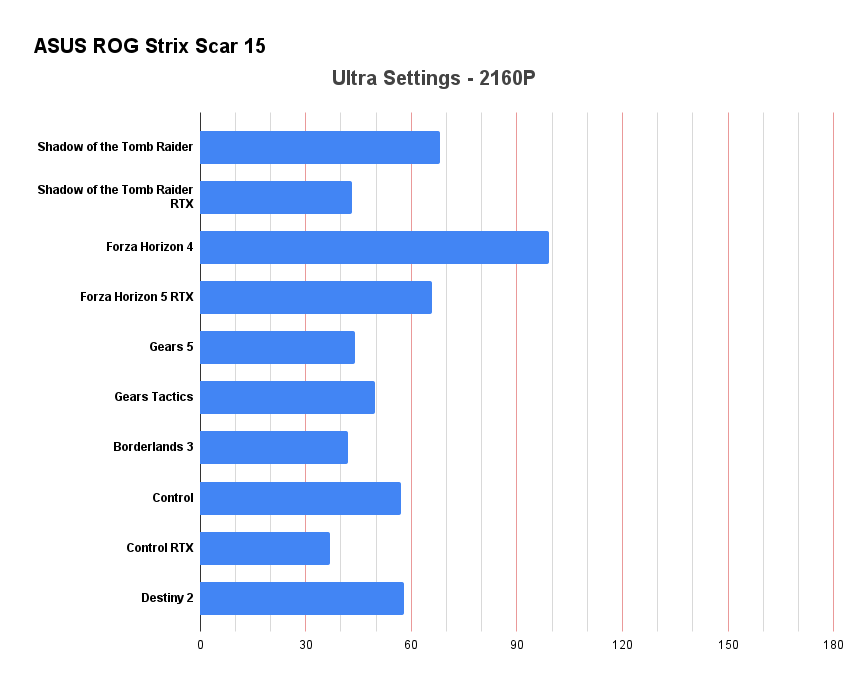
Performance comparisons
We’ve selected computers with varied GPUs and specifications for comparison to give you an idea of how it compares against a range of processors and system configurations. We find these comparisons useful for consumers looking for not only the best overall performance but the best value, too.
All of our comparison systems cost significantly more than the Scar 15 and most have a technically more powerful GPU, but as you can see, the Scar 15 more than holds its own in gaming performance. When it comes to system performance, though, the 12th Gen Intel CPU reigns supreme, with only the ROG Flow Z13 coming close.
| Laptop/PC | ASUS ROG Flow Z13 XG Mobile | ASUS ROG STRIX SCAR 15 2022 | Acer Predator Triton 500 SE | ASUS ROG Strix Scar 15 | ASUS ROG Zephyrus G15 | ASUS ROG Zephyrus M16 |
| Model | GZ-301ZE-LD220 | GZ533 | PT516-51S | G533QS-HQ132T | GA503QS-HQ003T | GU603HR-KR007R |
| Processor | i9-12900H | i9-12900H | i9-11900 | R9 5900HX | R9 5900HS | i9-11900H |
| GPU | RTX 3080 16 GB | RTX 3070Ti 8GB | RTX 3080 8Gb | RTX 3080 16GB | RTX 3080 8GB | RTX 3070 8GB |
| GPU TGP/TDP | 150W | 125W/150W Dynamic Boost | 110W | 115W/130W Dynamic Boost | 80W/100W Dynamic Boost | 80W/100W Dynamic Boost |
| Ram | 16GB DDR5-5200 | 16GB DDR5-4800 | 32GB DDR4-3200 | 32GB DDR4-3200 | 32GB DDR4-3200 | 32GB DDR4-3200 |
| SSD | 1TB PCIe 4.0 M.2 2230 SSD | 2TB PCIe M.2 NVMe SSD | 2 x 1TB M.2 NVMe SSD | 2 x 1TB M.2 NVMe SSD | 1TB M.2 | 2TB M.2 NVMe (RAID0) |
| Display | 1920×1200 120Hz | 2560×1440 240Hz | 2560*1600 165Hz | 1440p 165Hz | 1440p 165Hz | 2560×1600 165Hz |
| Price | £3,299 | £2,299 | £2,699 | £2,699 | £2,599 | £2,599 |
System Benchmark Results
Cinebench R23
- CineBench – CPU (Single)
- (High-performance mode / Auto Fan): 1935

- CineBench – CPU (Multi)
- (High-performance mode / Auto Fan): 19262
3DMark – Time Spy (DX12)
| ASUS ROG Flow Z13 – XG | ASUS ROG Strix Scar 15 | ASUS ROG Strix Scar 15 | ASUS ROG Zephyrus G15 | Acer Predator Triton 500 SE | ASUS ROG Zephyrus M16 | |
| Time Spy Score | 12261 | 11719 | 11125 | 10232 | 10309 | 9717 |
| Graphics | 11977 | 11509 | 11440 | 10383 | 10428 | 9732 |
| CPU | 14171 | 13078 | 9626 | 9454 | 9683 | 9635 |
3DMark – Fire Strike (DX11)
| ASUS ROG Flow Z13 – XG | ASUS ROG Strix Scar 15 | ASUS ROG Strix Scar 15 | ASUS ROG Zephyrus G15 | Acer Predator Triton 500 SE | ASUS ROG Zephyrus M16 | |
| Fire Strike Score | 26385 | 25682 | 23835 | 21547 | 22687 | 21363 |
| Graphics Score | 29477 | 29519 | 26593 | 23701 | 26800 | 24835 |
| Physics Score | 30516 | 31328 | 25494 | 23521 | 23877 | 24690 |
| Combined Score | 13261 | 11439 | 12709 | 11921 | 10194 | 9492 |
PCMark 10
| ASUS ROG Strix Scar 15 | ASUS ROG Flow Z13 – XG | ASUS ROG Strix Scar 15 | ASUS ROG Zephyrus G15 | Acer Predator Triton 500 SE | ASUS ROG Zephyrus M16 | |
| PCMark 10 | 8223 | 7783 | 7175 | 7062 | 6956 | 6951 |
| Essentials | 11173 | 11010 | 10383 | 10382 | 9499 | 9999 |
| App start-up | 17431 | 16278 | 15198 | 15095 | 12005 | 13589 |
| Video Conferencing | 7583 | 7922 | 7891 | 7921 | 7921 | 7847 |
| Web Browsing | 10554 | 10351 | 9336 | 9360 | 9015 | 9376 |
| Productivity | 10665 | 10475 | 9744 | 9646 | 9743 | 9004 |
| Spreadsheets | 13240 | 13261 | 11205 | 10997 | 12908 | 11050 |
| Writing | 8592 | 8275 | 8474 | 8461 | 7335 | 7337 |
| Content Creation | 12665 | 11095 | 9909 | 9543 | 9869 | 10123 |
| Photo Editing | 16387 | 13843 | 16185 | 15295 | 14191 | 14140 |
| Rendering & Visualisation | 17533 | 15219 | 11699 | 11151 | 11734 | 12460 |
| Video Editing | 7071 | 6484 | 5139 | 5096 | 5774 | 5889 |
Next: Storage, battery, pricing and summary

