
ASUS ROG Zephyrus M16: Performance

The Intel Core i9-12900H is an exceptionally good CPU and currently leads our benchmark leaderboards (though we have yet to test the Ryzen 6000 series). The Zephyrus M16 doesn’t push it quite as hard as the Scar 15 we just tested, but it’s still up there at the top of our rankings. Both for gaming and creative work, this is an outstanding CPU.
Just like all the rest of ASUS’s 2022 ROG laptops, the Zephyrus M16 has a MUX (multiplexer) switch, which allows it to bypass the iGPU and extract the full performance of the discrete GPU. This applies to the in-built display as well as all of the external display connections. If you are out and about or using battery power, you’re better off allowing Optimus to do its thing, as running solely on the dGPU can drain your battery fast. If you can plug into the mains, though, activating MUX within the Armoury Crate software is a no-brainer – with it activated you can see gains of up to and over 5% more FPS.
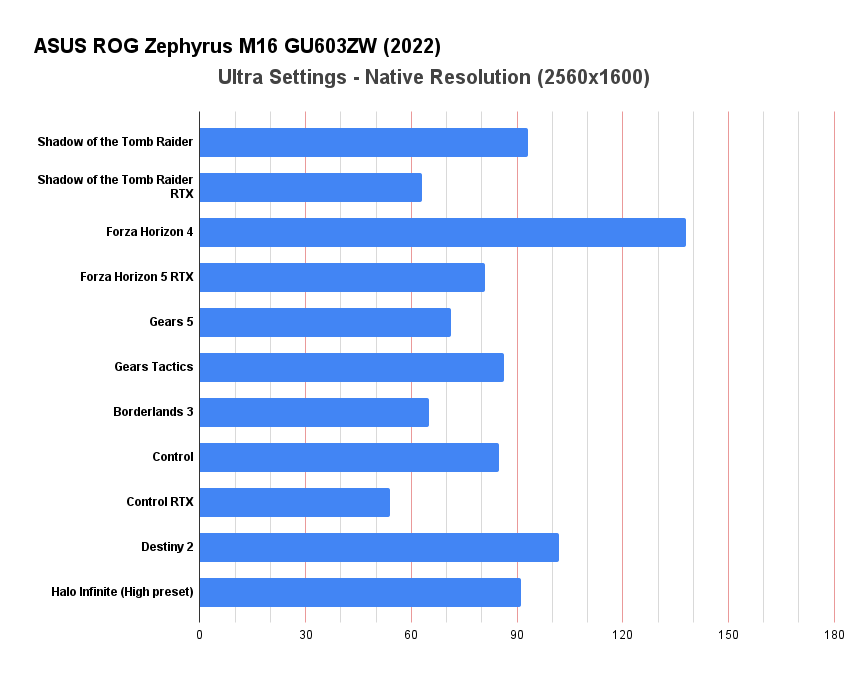
The new RTX 3070 Ti is an excellent GPU, and compared to the RTX 3070 in the 2021 M16 performance is notably better, especially with the TGP increase to 100W (120W dynamic boost). Apart from ‘Control’ with full RTX effects enabled, every game I tested cleared 60fps easily, and when connected to an external display I even achieved playable frame rates at 4k. Competitive titles should have no problem coming close to or matching the maximum refresh of 165Hz, and playing AAA titles at ultra settings should be no problem for a good few years.
When I reviewed the previous M16 I found the underpowered GPU to be letting it down in our comparisons, but this variant of the M16 is capable of performing just as good as some of the RTX 3080 systems we’ve tested. Now that you’re getting ultra-fast DDR5 memory and a more potent CPU, too, this is an ideal system for creators or those who need to run intensive technical software as well as the latest games.
Benchmarks
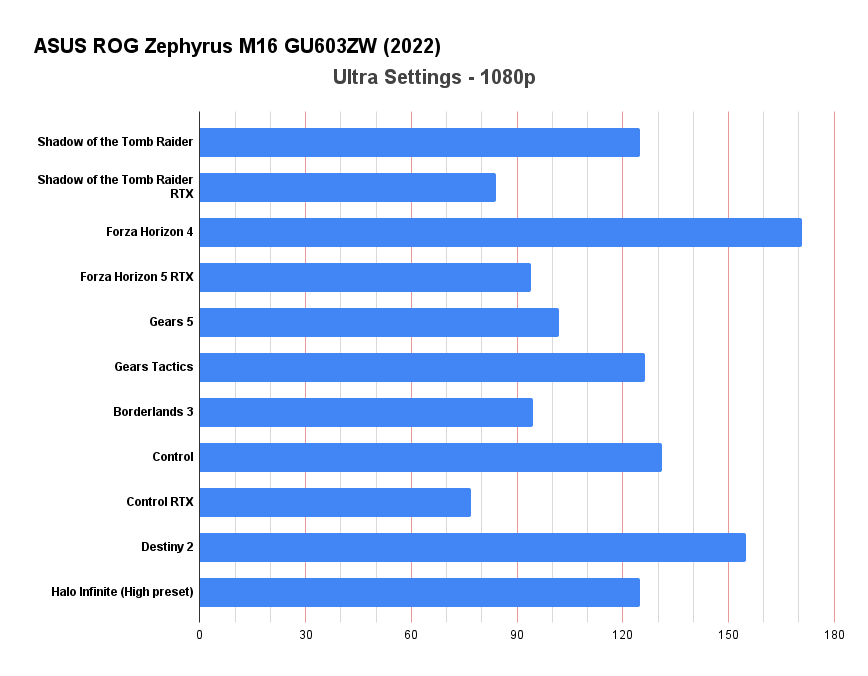
All benchmark tests were carried out with the performance mode set to Turbo in the Armoury Crate software, which overclocks the GPU and runs the CPU at its maximum, dynamically adjusting fan speed to keep everything cool.
Benchmarks were recorded at 2560×1600 using the inbuilt display, and at 1080p, 1440p and 2160p using an external display connected via DisplayPort over USB-C. If DLSS was available, it was set to performance mode unless stated otherwise.
Gaming Benchmark Results


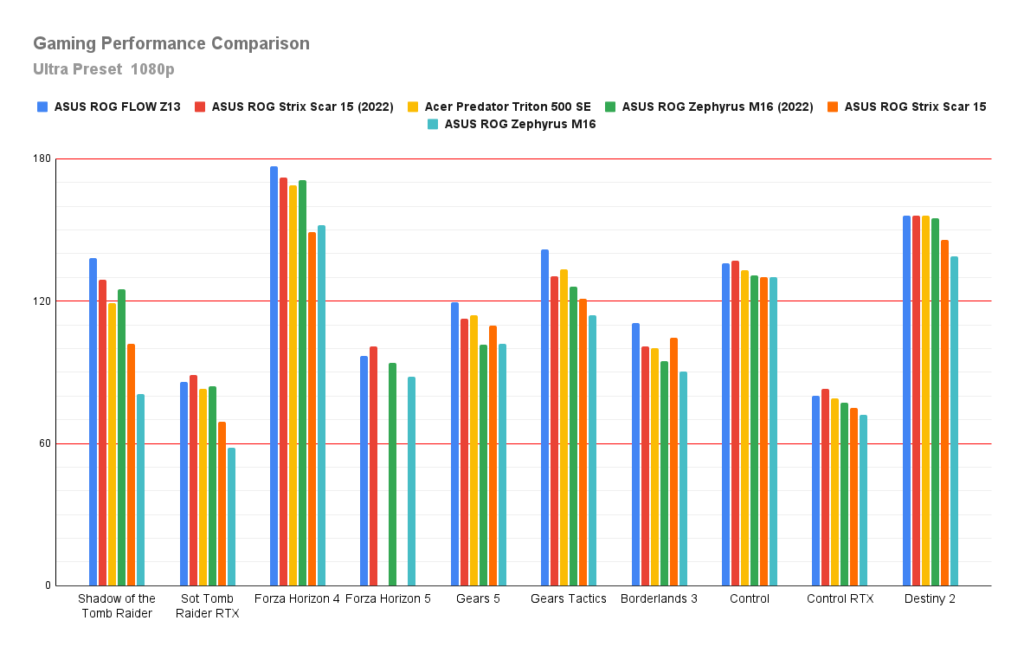
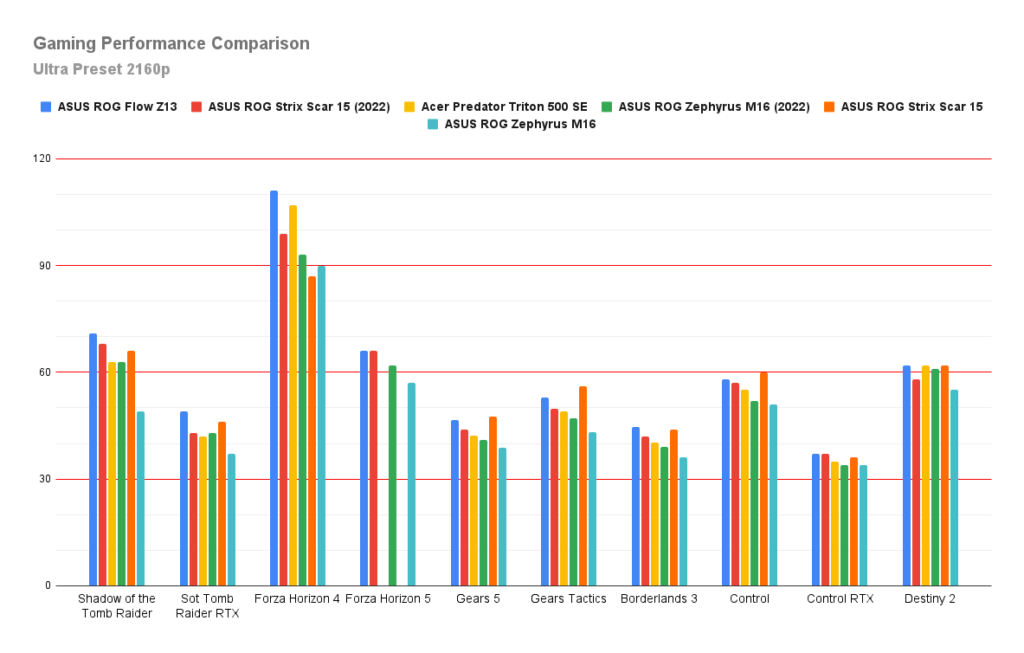
Performance comparisons
We’ve selected computers with varied GPUs and specifications for comparison to give you an idea of how it compares against a range of processors and system configurations. We find these comparisons useful for consumers looking for not only the best overall performance but the best value, too.
We’ve made sure to include the previous M16 we tested, as well as the similarly specced Scar 15 2022, and the Scar 15 2021 so you can see the level of CPU performance versus the Ryzen 9 5900HX.

| Laptop/PC | ASUS ROG Flow Z13 XG Mobile | ASUS ROG STRIX SCAR 15 2022 | ASUS ROG Strix Scar 15 | Acer Predator Triton 500 SE | ASUS ROG Zephyrus M16 (2022) | ASUS ROG Zephyrus M16 |
| Model | GZ-301ZE-LD220 (2022) | GZ533 | G533QS-HQ132T | GU603ZW-K8015W | GU603HR-KR007R | |
| Processor | i9-12900H 45W 5GHz 16c20t | i9-12900H | R9 5900HX | i9-11900 | i9-12900H | i9-11900H @ 2.5GHz |
| GPU | RTX 3080 16 GB | RTX 3070Ti 8GB | RTX 3080 16GB | RTX 3080 8Gb | RTX 3070 Ti 8GB | RTX 3070 8GB |
| GPU TGP/TDP | 150W | 125W/150W Dynamic Boost | 115W/130W Dynamic Boost | 110W | 100W/120W Dynamic Boost | 80W/100W Dynamic Boost |
| Ram | 16GB DDR5-5200 | 16GB DDR5-4800 | 32GB DDR4-3200 (16+16) | 32GB DDR4-3200 | 32GB DDR5-4800 | 32GB DDR4-3200 |
| SSD | 1TB PCIe 4.0 M.2 2230 SSD | 2TB PCIe M.2 NVMe SSD | 2 x 1TB M.2 NVMe SSD | 2 x 1TB M.2 NVMe SSD | 2TB M.2 NVMe Samsung | 2TB M.2 NVMe (RAID0) |
| Display | 1920×1200 Pantone | 2560×1440 240Hz | 1440p 165Hz Pantone | 2560*1600 165Hz | 2560×1600 165Hz (16:10) | 2560×1600 165Hz (16:10) |
| Price | £3,299 | £2,299 | £2,699 | £2,699 | £2,599 | £2,599 |
System Benchmark Results
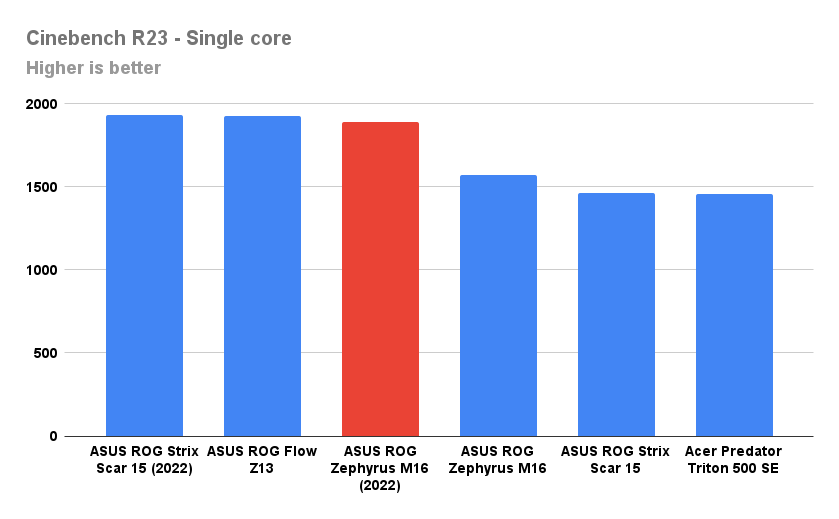
Cinebench R23
- CineBench – CPU (Single)
- (High-performance mode / Auto Fan): 1893
- CineBench – CPU (Multi)
- (High-performance mode / Auto Fan): 18794

3DMark – Time Spy (DX12)
| ASUS ROG Flow Z13 – XG | ASUS ROG Strix Scar 15 (2022) | ASUS ROG Zephyrus M16 (2022) | ASUS ROG Strix Scar 15 | Acer Predator Triton 500 SE | ASUS ROG Zephyrus M16 | |
| Time Spy Score | 12261 | 11719 | 11211 | 11125 | 10309 | 9717 |
| Graphics | 11977 | 11509 | 10787 | 11440 | 10428 | 9732 |
| CPU | 14171 | 13078 | 14424 | 9626 | 9683 | 9635 |
3DMark – Fire Strike (DX11)
| ASUS ROG Flow Z13 – XG | ASUS ROG Strix Scar 15 (2022) | ASUS ROG Zephyrus M16 (2022) | ASUS ROG Strix Scar 15 | Acer Predator Triton 500 SE | ASUS ROG Zephyrus M16 | |
| Fire Strike Score | 26385 | 25682 | 24871 | 23835 | 22687 | 21363 |
| Graphics Score | 29477 | 29519 | 27526 | 26593 | 26800 | 24835 |
| Physics Score | 30516 | 31328 | 31694 | 25494 | 23877 | 24690 |
| Combined Score | 13261 | 11439 | 12154 | 12709 | 10194 | 9492 |
PCMark 10
| ASUS ROG Strix Scar 15 (2022) | ASUS ROG Zephyrus M16 (2022) | ASUS ROG Flow Z13 – XG | ASUS ROG Strix Scar 15 | Acer Predator Triton 500 SE | ASUS ROG Zephyrus M16 | |
| PCMark 10 | 8223 | 8048 | 7783 | 7175 | 6956 | 6951 |
| Essentials | 11173 | 10943 | 11010 | 10383 | 9499 | 9999 |
| App start-up | 17431 | 15531 | 16278 | 15198 | 12005 | 13589 |
| Video Conferencing | 7583 | 7804 | 7922 | 7891 | 7921 | 7847 |
| Web Browsing | 10554 | 10812 | 10351 | 9336 | 9015 | 9376 |
| Productivity | 10665 | 10631 | 10475 | 9744 | 9743 | 9004 |
| Spreadsheets | 13240 | 12980 | 13261 | 11205 | 12908 | 11050 |
| Writing | 8592 | 8708 | 8275 | 8474 | 7335 | 7337 |
| Content Creation | 12665 | 12158 | 11095 | 9909 | 9869 | 10123 |
| Photo Editing | 16387 | 15801 | 13843 | 16185 | 14191 | 14140 |
| Rendering & Visualisation | 17533 | 16334 | 15219 | 11699 | 11734 | 12460 |
| Video Editing | 7071 | 6964 | 6484 | 5139 | 5774 | 5889 |